
6 Forecast Categories in Salesforce
Forecast categories form the basis of Salesforce forecasting.
They are the labels used to categorize opportunities within the sales pipeline based on their likelihood of closing successfully.
These categories provide insights into the sales team’s expectations for each opportunity and help predict future sales revenue.
Categories can vary based on your industry or company, but here are the most common categories found across sales organizations:
- Pipeline: Represents the collective total of every opportunity that your sales teams are currently managing. In other words, pipelinerepresents the opportunities that are in the early stages of the sales cycle.
- Best Case: Indicates the opportunities that have the potential to close but are not expected to for whatever reason. This forecast category represents the most favorable scenario for your forecast, and it includes all qualified opportunities.
- Commit: Represents deals that the sales team has committed to closing within a specific time frame. These opportunities are considered more reliable and serve as the bare minimum value for your forecast attainment. They’re considered guaranteed to close by sales leadership when creating a forecast number.
- Most Likely: Represents deals that are not guaranteed but have a high probability of closing in a specific time period. Combined with the Commit category, this forms the basis of a realistic forecast.
- Omitted: Designates opportunities that were initially considered but have been intentionally left out of the current forecast for various reasons (such as low probability or disqualification (also known as DQ)).
- Closed: Indicates deals that have been closed, meaning that the sales process has been completed. In this case, the opportunity has resulted in either a sale or has been lost and removed from the pipeline.
Now that we’ve covered the category types most commonly used in sales forecasting, let’s go over the different forecasts you can leverage in Salesforce.
What Are the Different Types of Forecasts in Salesforce?
There are four types of forecasts in Salesforce:
- Overlay Split Forecasts: This forecast type reveals the impact of sales team members who contribute to a closed deal, even if they are not directly accountable for the sale. Overlay split forecasts offer a comprehensive view of your team’s selling strategy.
- Revenue Split Forecasts: These are similar to overlay split forecasts but allocate credits to sales representatives or team members directly responsible for any deal. It uses splits that can total 100% of the opportunity (unlike overlay splits that can exceed 100%).
- Product Family Forecasts: Product family forecasts encompass the expected revenue and quantity sold for a group of related products. These forecasts can be useful to those who want results based on certain product groups/categories.
- Territory Forecasts: This forecast type is useful if you use the Enterprise Territory Management feature in Salesforce. Territory forecasts extend beyond forecasting future sales performance solely by representatives. Instead, they allow forecasting by territory, irrespective of the assigned reps to those opportunities.
Now, let’s go over how to set up forecasting in Salesforce:
How Do You Set Up Forecasting in Salesforce? (Step-by-Step)
Here are the steps you need to follow to set up forecasting in Salesforce:
- Step #1: Enable Forecasting
- Step #2: Enable Users
- Step #3: Create a Forecast Hierarchy
- Step #4: Customize Forecast Categories
- Step #5: Determine the Forecast Date Range
- Step #6: Choose a Forecast Currency
Step #1: Enable Forecasting
The first step involves ensuring that forecasting is enabled on Salesforce.
Here’s how to do that:
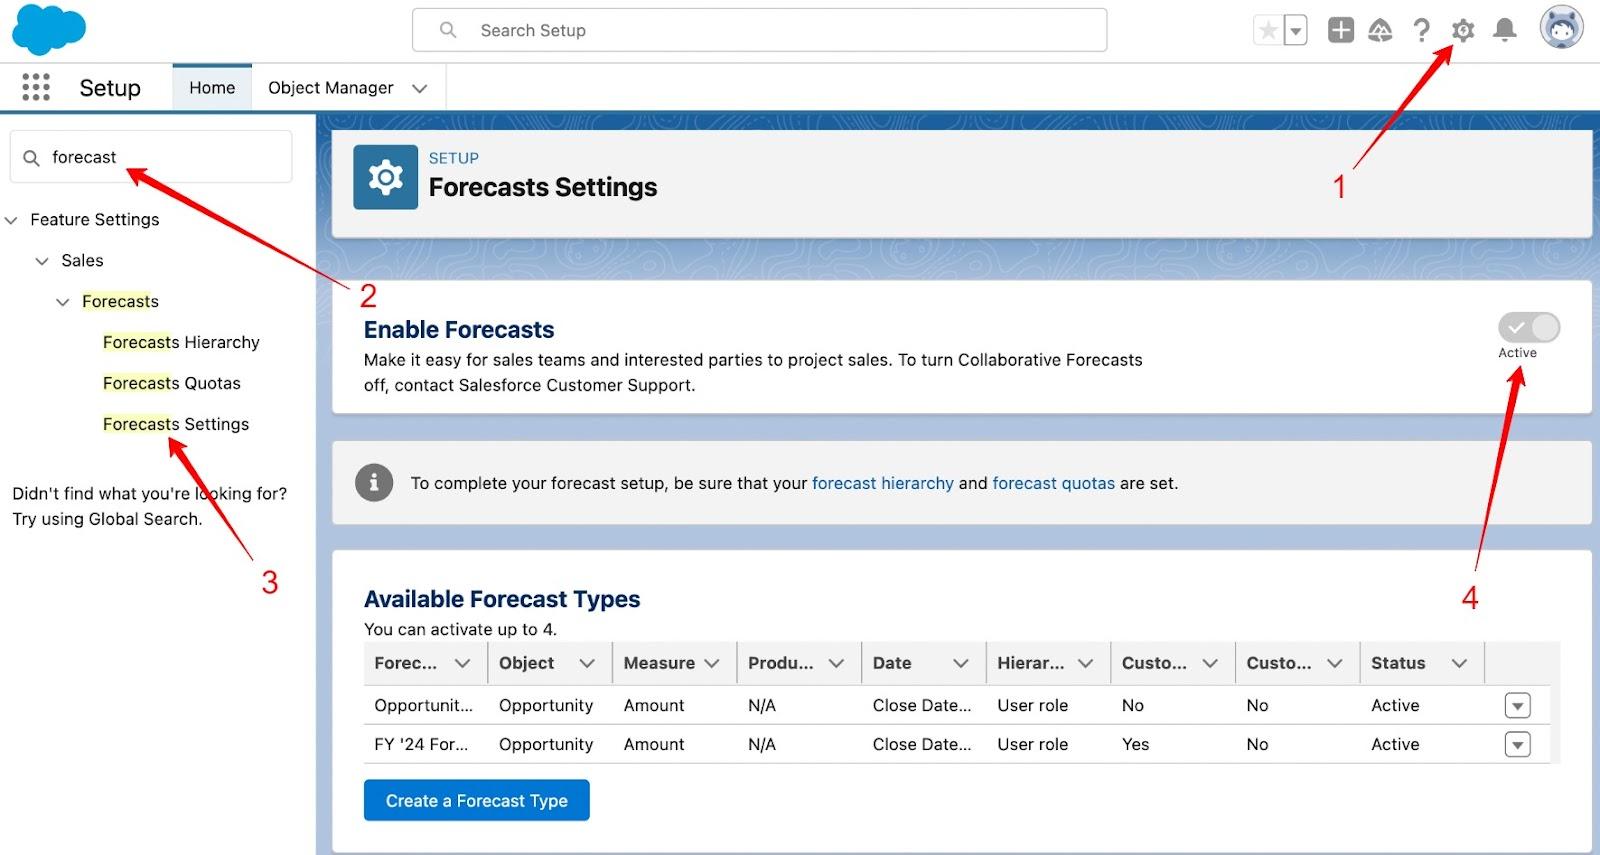
- Click the gear icon in the top-right corner and select Setup.
- Type Forecast in the Quick Find box in the top-left corner.
- Select the Forecasts Settings option when it appears.
- Check the Enable forecasts box.
- Scroll down to the Enable Forecasts Adjustments section.
- Check the Enable manager adjustments and the Enable owner adjustments boxes.
Step #2: Enable Users
Now, you need to ensure that users who need access to forecasting have the appropriate permissions.
Here’s how you can do that in Sales Cloud:
- While on the Setup page, navigate to the ADMINISTRATION section on the left-hand side.
- Click Users from the options.
- To edit the permissions for a specific user, click the Edit button next to the user. This should display the General Information box.
- Check the Allow Forecasting box and then click Save.
Step #3: Create a Forecast Hierarchy
Now that you’ve provided access to the relevant team members, it’s time to set up a forecast hierarchy.
But what is a forecast hierarchy?
A forecast hierarchy represents the organizational structure or reporting hierarchy within your business. It defines how users are organized into different levels or roles for the purpose of collaborative forecasting.
Collaborative forecasting involves collective input from various stakeholders, such as sales and marketing teams — fostering collaboration to generate more accurate and insightful forecasts.
This hierarchy helps determine reporting relationships and how forecasting data flows within your organization.
Here are the steps for creating a forecast hierarchy:
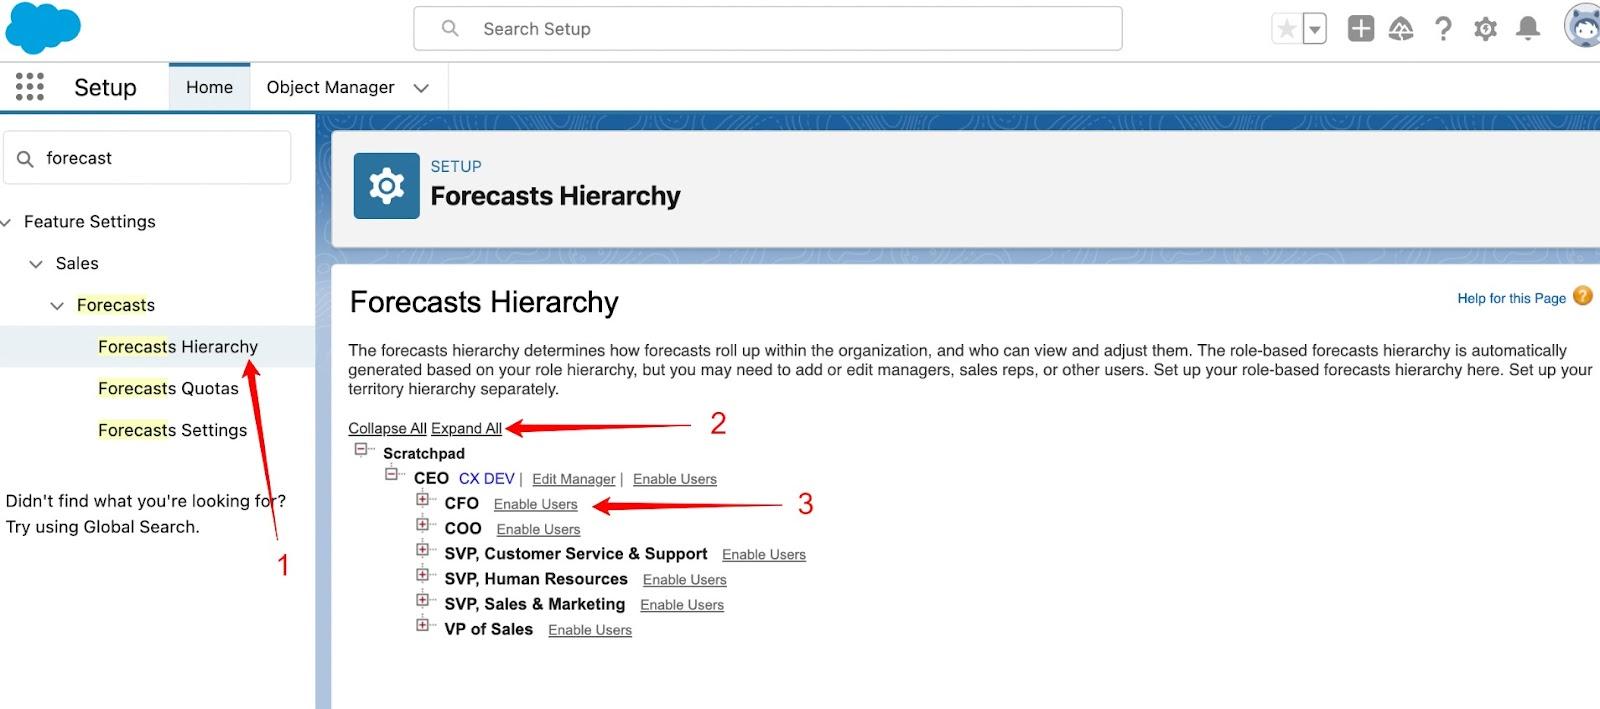
- When you’re on the Setup page, type Forecast Hierarchy in the Quick Find box.
- Select Forecasts Hierarchy from the options.
- Click Expand All to see the available roles.
- Click the Enable Users option next to one of the roles displayed.
- Move users from the Available Users section to the Enabled Users list.
- To assign a forecast manager for each role in the hierarchy, click Assign Manager next to the specific role. From there, select a name from the Forecast Manager drop-down list and click Save.
Repeat the same steps and apply them for each role type.
Step #4: Customize Forecast Categories
To perform accurate sales forecasting, you’ll need to assign different opportunities to various forecast categories (such as Pipeline, Commit, Best Case, Omitted, or Closed).
Forecast categories pinpoint distinct stages within the sales cycle, offering a clear indication of the status of an opportunity. Essentially, they serve as markers indicating the position of leads in the sales forecasting process.
Here are the steps to customize forecast categories:
- While on the Setup page, click the Object Manager drop-down menu.
- Navigate to Opportunity > Fields & Relationships > Forecast Category.
- When in the Salesforce Forecast Category Picklist Values section, Click the Edit option that appears next to the value that you want to customize.
- Enter a category name (such as Commit or Closed) in the Label field.
- Click the Save button.
After customizing the forecast categories, you can view them in the Forecasts tab.
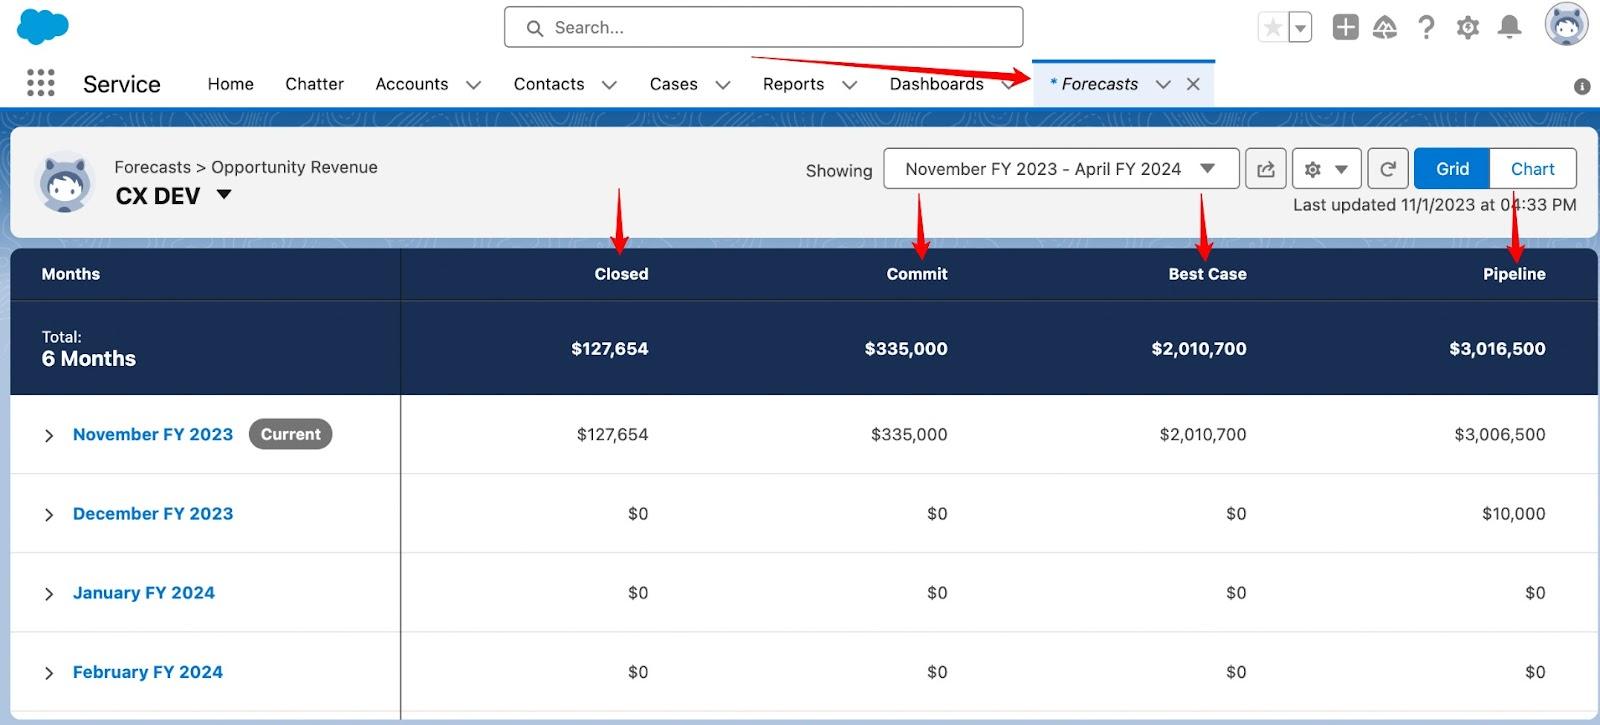
Each forecast category within the Forecasts tab shows the total dollar amount associated with it over a given period of time.
What if you want to view the details for specific opportunities?
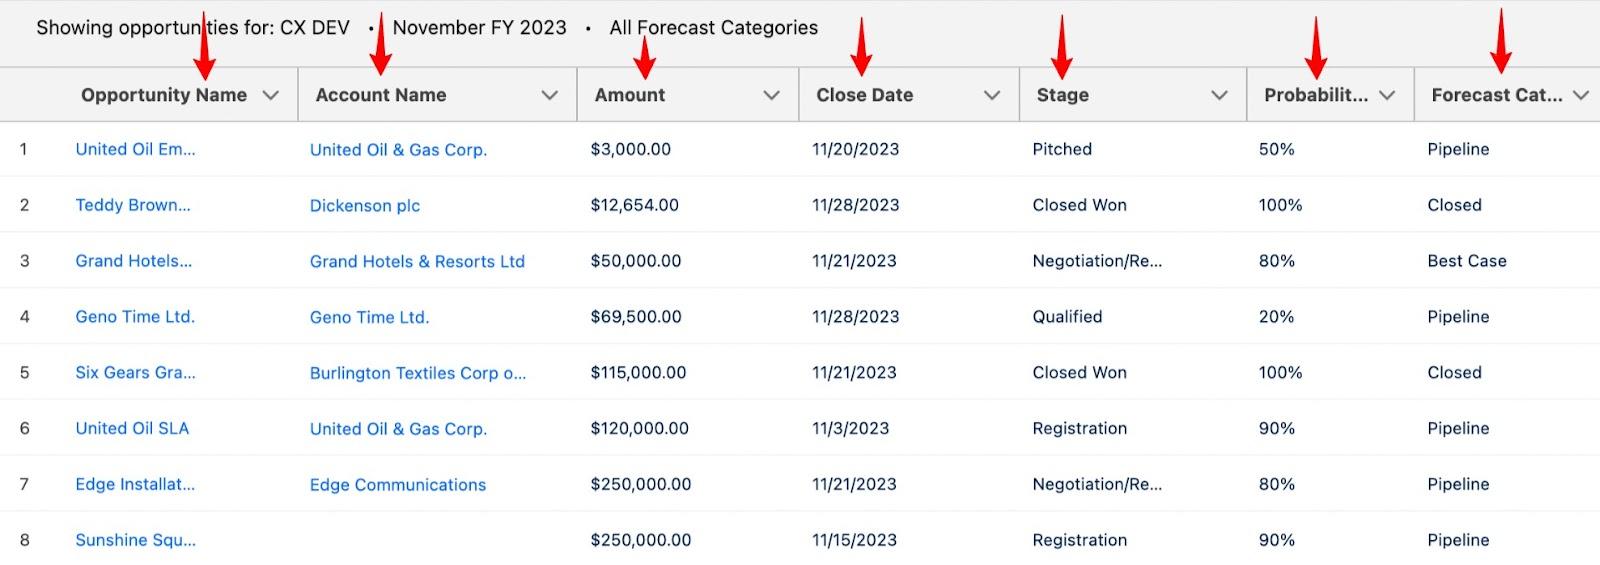
To do that, expand one of the options in the “Months” category (like the “November FY 2023” option, for example).
You should see various opportunities and their details (such as the opportunity name, the account name, amount, forecast category, and more).
Step #5: Determine the Forecast Date Range
Determining the forecast date range in Salesforce is essential to provide accurate, consistent, and relevant insights into sales activities.
Here’s how to determine the forecast date range in Salesforce:
- Navigate to the Forecast Settings page.
- Scroll down to the Configure the Default Forecast Display section.
- Determine the forecast date range by using the arrow buttons next to Forecast Period, Starting on, and Display.
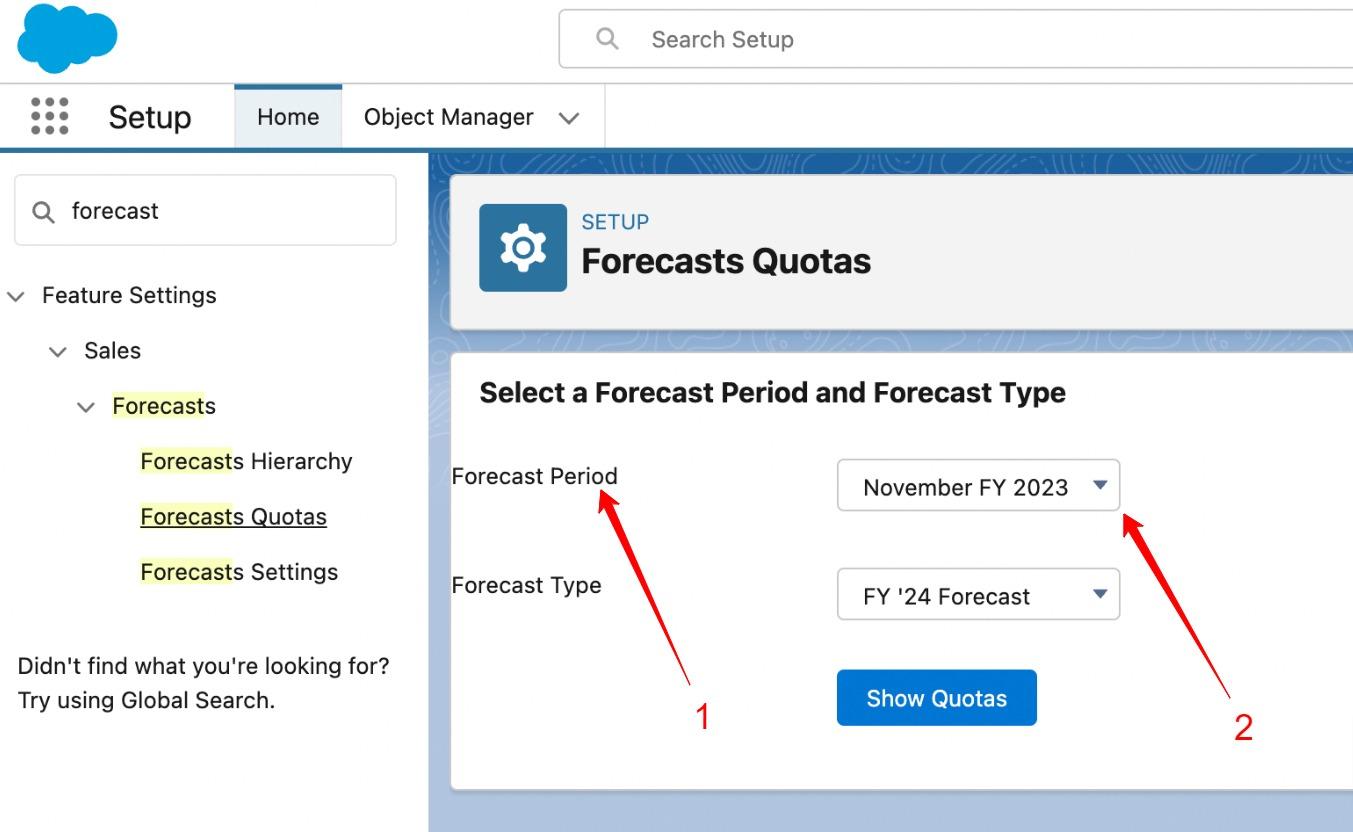
- Click the Save button.
Step #6: Choose a Forecast Currency (Optional)
If your company trades in multiple currencies, you can adjust the forecast currency through these steps:
- Navigate to Setup, type Forecast Settings in the Quick Find box, and then select Forecasts Settings from the options.
- Scroll down to the Default Currency section.
- Choose a currency from the Forecast Currency category.
- Click the Save button.
Now, here’s the big question:
Is Salesforce forecasting efficient?
Not quite!
3 Reasons Why Salesforce Forecasting Is Inefficient
Here’s the deal — forecasting in Salesforce can be challenging, even for experienced sales professionals.
Fortunately, there are solutions to Salesforce’s issues.
Let’s go over some of the Salesforce problems you might face and how a tool like Scratchpad can solve those drawbacks for you.
For context, Scratchpad is a tool that helps sales teams work together and work faster in Salesforce. It’s designed to make managing pipelines, inspecting deals, coaching, and forecasting fast, simple, and delightful.

Salesforce Forecasting Problem #1
Salesforce has a steep learning curve for most reps because it’s not designed for the way they work.
As a result, managing pipelines in Salesforce is inefficient and leads to data being stored outside of the CRM (Customer Relationship Management) tool.
So, sales leaders don’t have the visibility they need to inspect deals and pipelines, and forecasting is both time consuming and challenging.
Additionally, forecasting in Salesforce isn’t the most user-friendly for sales leaders either. So, they often turn to using something more familiar and user-friendly such as a spreadsheet to create and manage their forecasts.
The problem here is that they then have to pull CRM data from Salesforce and create their own roll-up in a spreadsheet and that data is often unreliable due to reps recording their information outside of the Salesforce CRM.
The manual nature of this sales process is challenging and prone to errors. Not only that, as you’re operating in different places, a lot of context goes missing.
For example, if you’re a sales leader and notice an adjustment made to a spreadsheet entry, there’s no way to track which rep or sales manager made that change, or why it was made.
So not only do you have potentially erroneous data, but you also don’t have the necessary historical data to read that information contextually.
Scratchpad’s Solution: Efficient Rollups
Scratchpad automates the rollup process, eliminating the need to use a spreadsheet.
Scratchpad’s rollup feature improves your forecasting accuracy and helps you track how each deal changes over time – giving you the necessary context behind changes.
For instance, here’s a rollup chart showing how each deal has been changing over time:
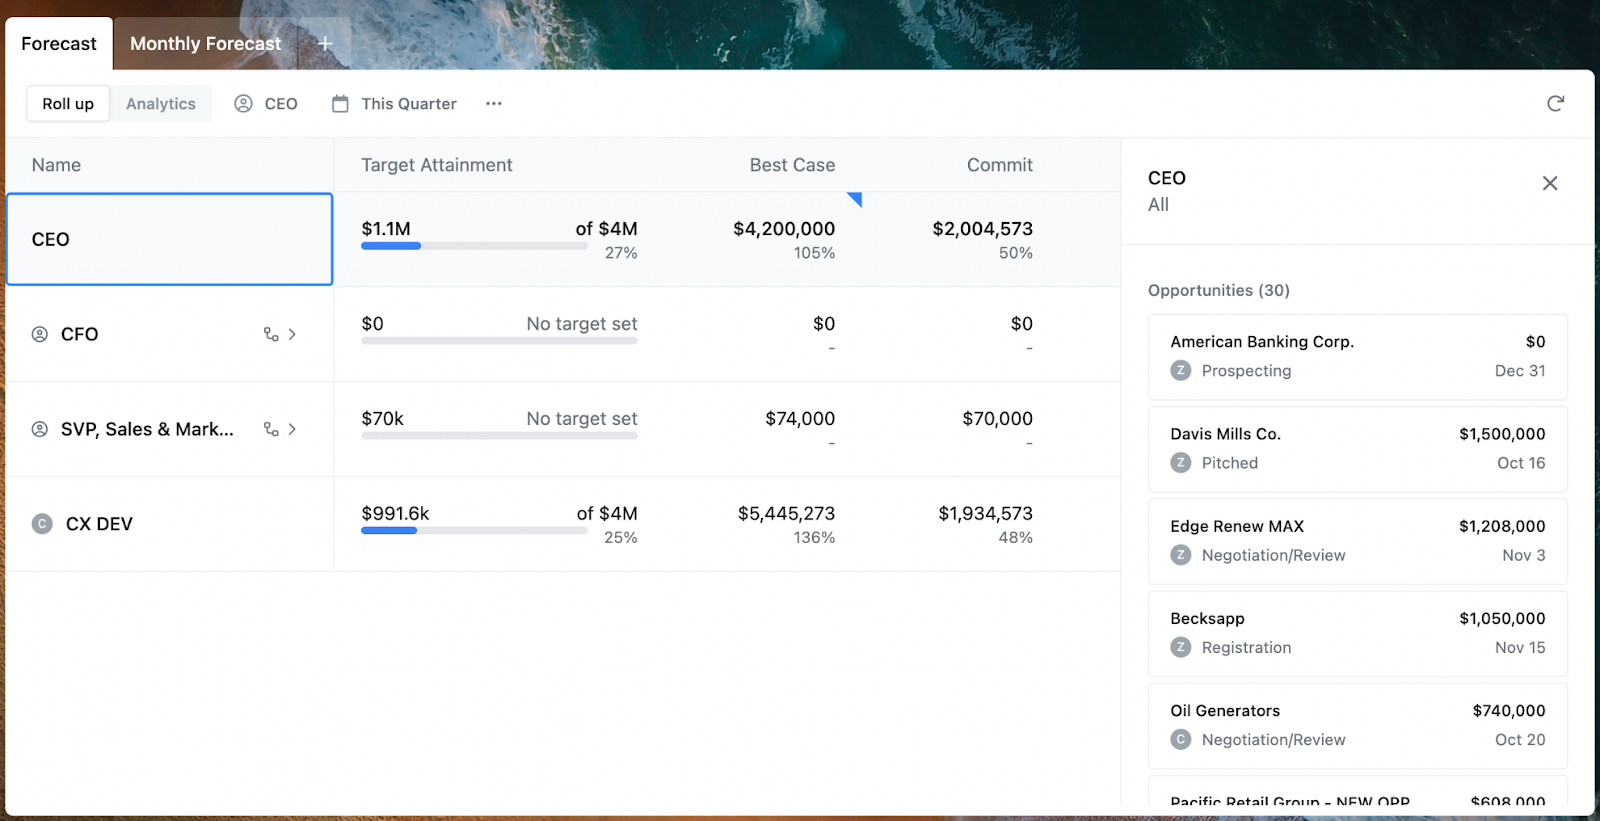
It’s now easier than ever to drill down to see potential gaps or red flags that could prevent a deal from closing without resulting in a sale.
Additionally, unlike spreadsheets, the Scratchpad roll-up is dynamic. The forecast figures are automatically updated in real time when reps make changes to various opportunities.
With one click, sales leaders can view every data point tied to that opportunity, allowing them to better analyze and assess the deal quality.
Salesforce Forecasting Problem #2
When using Salesforce forecasting, you have to use traditional data analysis methods that involve manually inputting data into spreadsheets daily and opening up innumerable tabs.
It’s no surprise that this process is tedious and time-consuming.
Some organizations hire data scientists and purchase expensive BI tools to snapshot their Salesforce CRM to solve this. But then, there’s no easy way to visualize the information and understand where things stand at a glance — especially if you’re a sales leader.
Scratchpad’s Solution: Sales Trends Analytics
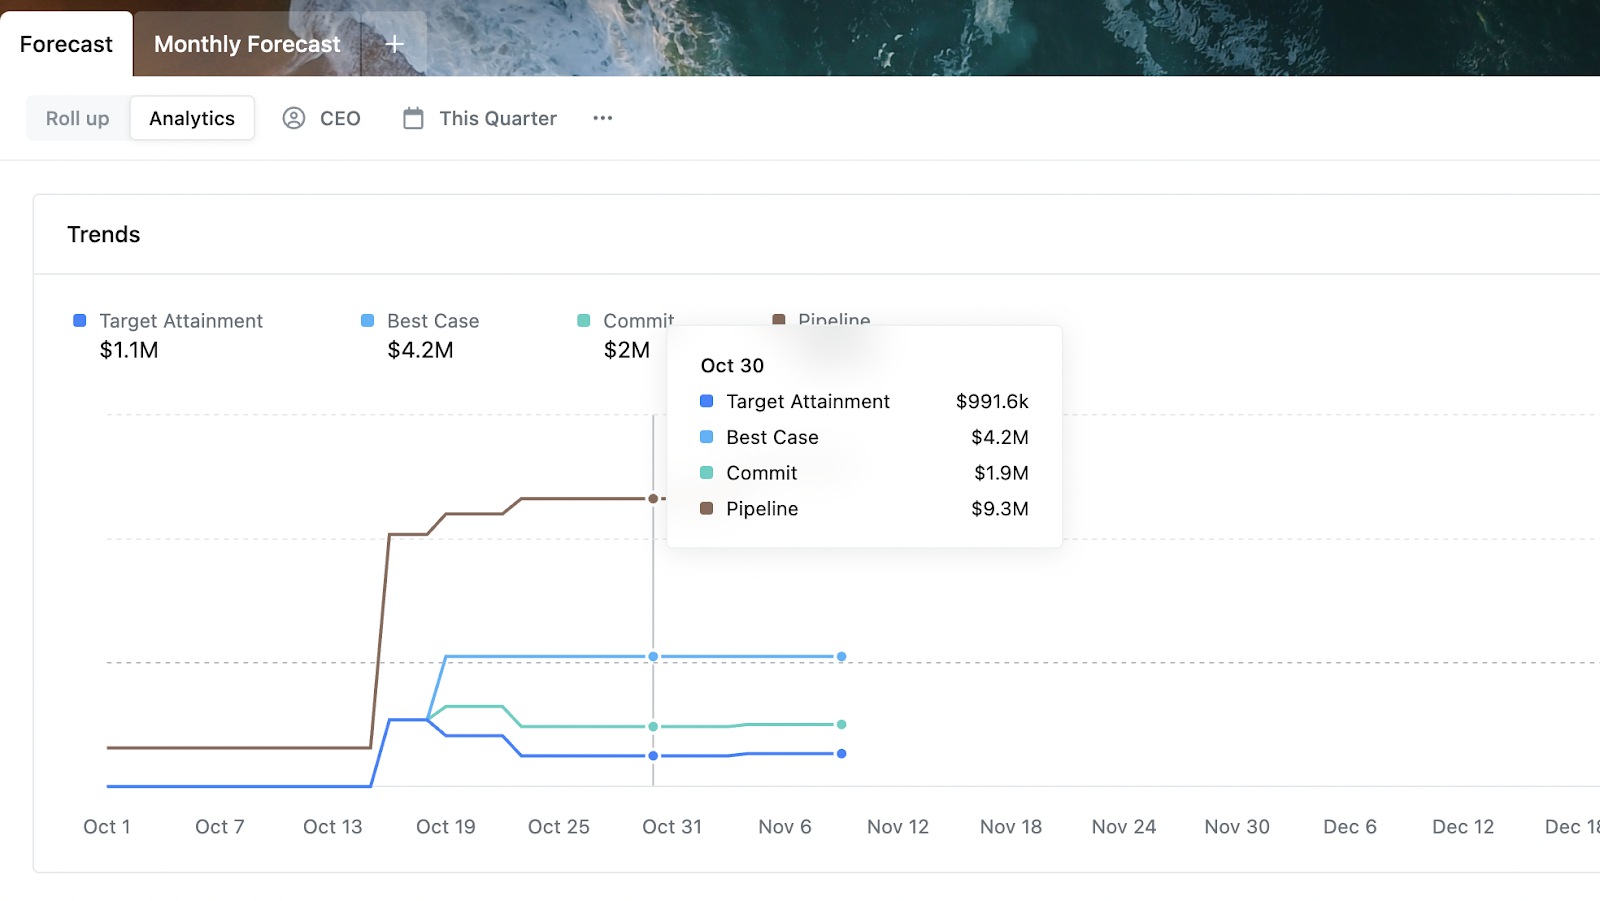
Scratchpad’s Sales Trends Analytics help you identify trends in how the forecast evolved over time, enabling you to compare this data to that of past months, quarters, or years.
Within Trends Analytics, Scratchpad’s Daily Snapshots give you a historical record of pipeline changes made daily and allow you to drill down into how trends change at any given time. No more spreadsheet tabs!
Additionally, Scratchpad’s Waterfall Analytics offer a detailed breakdown of your forecast changes and, more importantly, the reasons behind them. This ensures that you get an accurate forecast that will allow you to make informed decisions in your business.
In Waterfall Analytics, there are different categories that represent a change that occurred in the forecast category’s revenue numbers.
These categories are Date pulled, Date pushed, Moved in, Moved out, and Value:
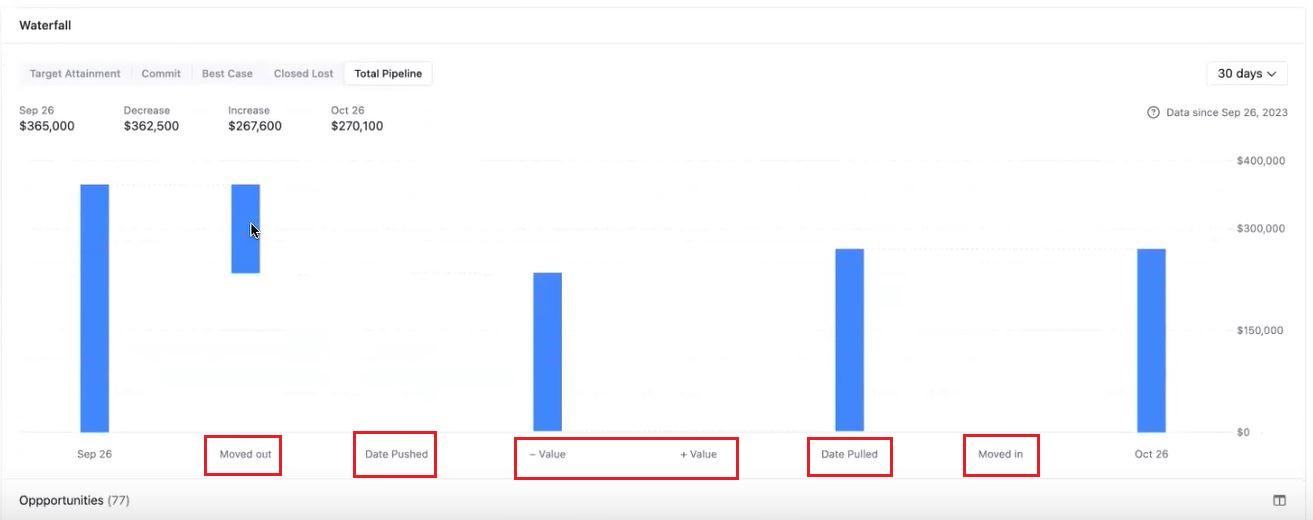
Let’s discover what each category means:
- Date pulled: Indicates an opportunity that fell within the forecast time period due to a moved-up close date.
- Date pushed: Represents a deal that got pushed to the next quarter.
- Moved in: indicates a new deal that entered the pipeline and can be tracked in the forecast.
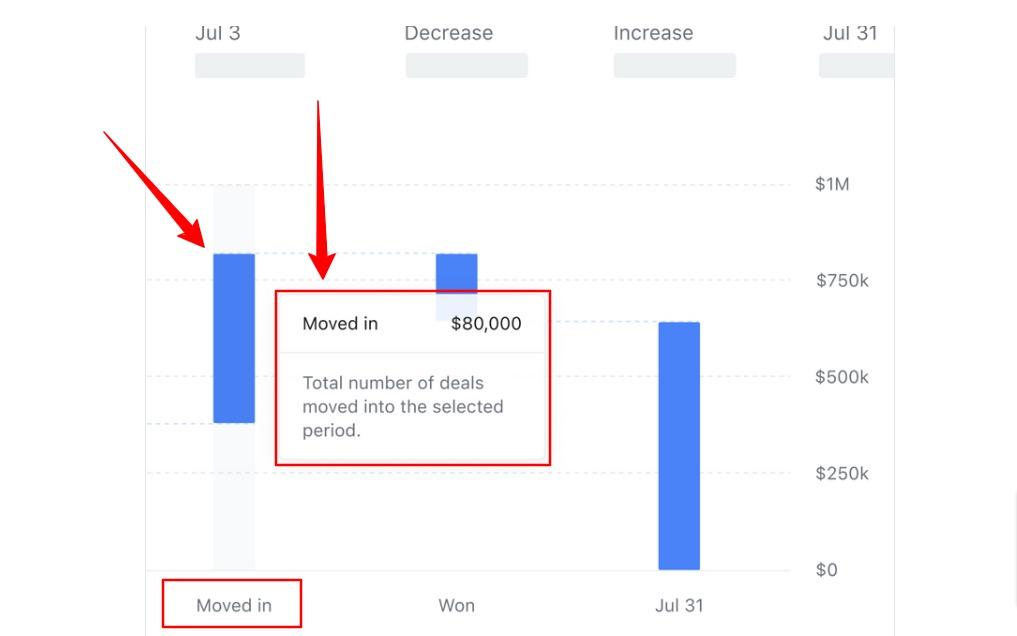
- Moved out: Signifies a deal that no longer matches the category filters or has been closed and moved out of the pipeline.
- Value: Shows the increase or decrease in the dollar amount of a deal within the category.
And that’s not all…
You aren’t limited to visualizing things by forecast category (such as Best Case, Commit, etc).
You can also view your forecast by sales stage (such as Qualified, Proposal, Negotiation, etc).
This can make it easier for sales leaders to identify where issues lie and step in to help reps with deals stuck in specific sales stages.
Salesforce Forecasting Problem #3
Salesforce is not designed for the way salespeople work.
This means that reps, managers, and leaders will resort to a crowded tech stack of notes, spreadsheets, and other tools that are disconnected from the CRM.
Why?
Because it’s easier and more efficient for day-to-day activities.
The problem is that this leads to out-of-date and incorrect information in the CRM, lack of visibility for leadership, inaccurate forecasts, and a higher potential for lost sales revenue.
Scratchpad’s Solution: Scratchpad Command
The Scratchpad Command tool brings Salesforce to users no matter where they are on the web — consolidating disconnected note-taking apps, spreadsheets, docs, and more.
It offers a sales rep or sales manager an easier way to manage their entire pipeline. This is especially useful for sales teams that have most of their work outside the CRM or are managing several sales opportunities simultaneously.
- Scratchpad Commands allows the user to:
- Search, update, create, and view any records.
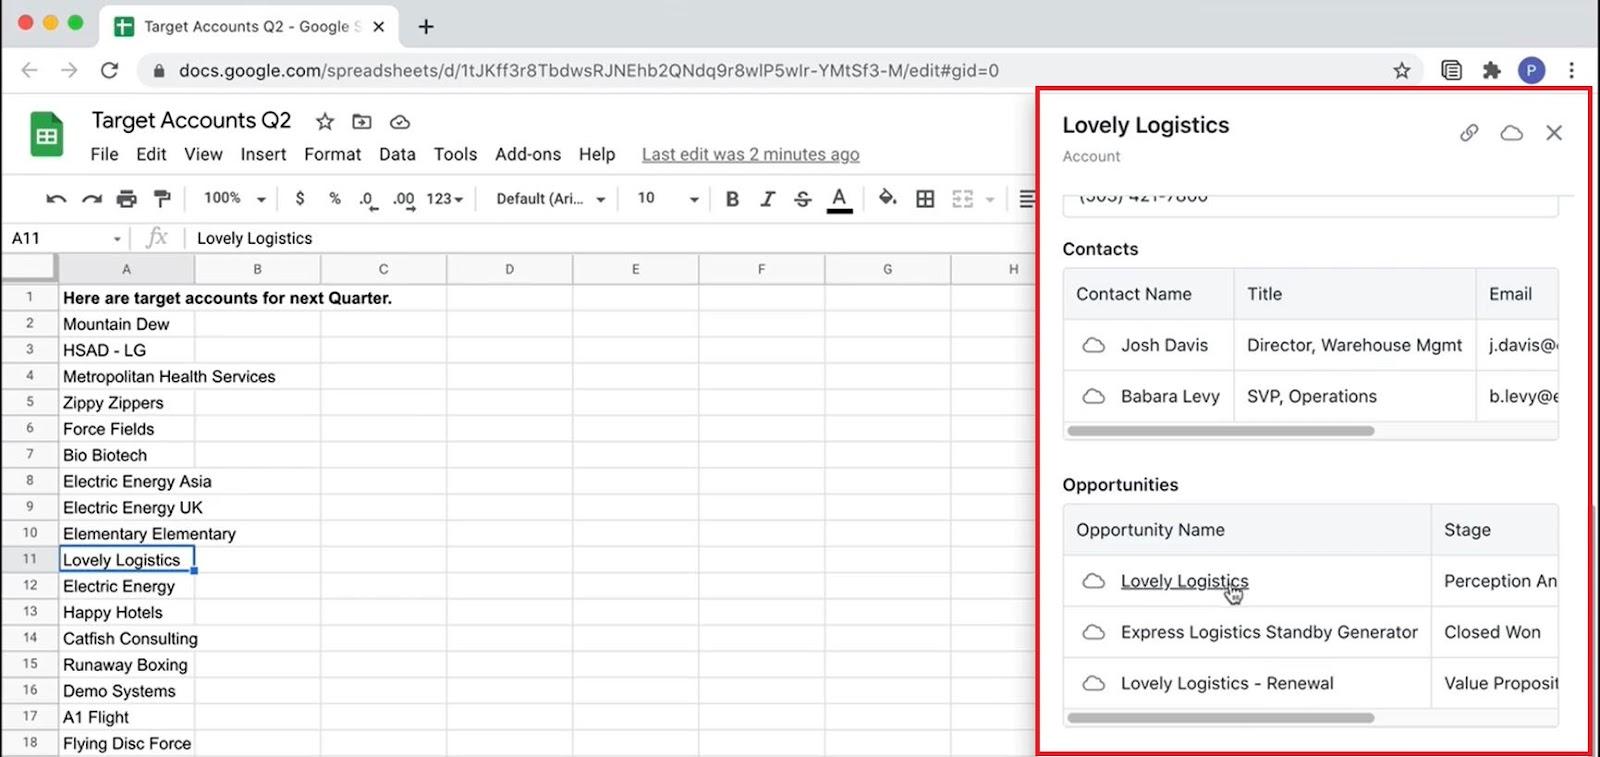
- Easily import data from a spreadsheet or a prospect’s website to the Customer Relationship Management tool. For example, customers may store data points not tied to specific fields in the CRM in Google Sheets. They can use Scratchpad commands directly from Google Sheets to easily port data into Scratchpad/Salesforce.
Here’s a screenshot showing Google Sheets and the Scratchpad Command feature (Scratchpad Command appears on the right-hand side):
Try Scratchpad forecasting free and discover a better way to forecast without spreadsheets and Salesforce reports.
Still need some clarity on a few forecasting questions?
2 Sales Forecasting FAQs
Here are the answers to some common questions you may have about sales forecasting:
1. Why Is Forecasting Important in Salesforce?
Forecasting is essential for:
- Strategic Planning: Forecasting guides strategic planning and allows you to make informed decisions by providing data-driven insights into future sales performance.
- Resource Allocation: It helps in the efficient allocation of resources based on predicted sales needs.
- Revenue Prediction: You get accurate estimates of future sales performance and expected revenue, which helps with financial planning.
- Sales Visibility: You gain visibility into the sales pipeline and opportunities at various stages.
- Goal Setting: An accurate forecast facilitates the setting of realistic and achievable sales targets.
2. Who Is Responsible for Monitoring Salesforce Forecasts?
The people responsible for monitoring Salesforce forecasts typically are:
- Product Leaders: Provide insights into the performance of existing features/products, upcoming releases, and market demand.
- Sales Leaders: Set sales targets, provide strategic direction, and contribute to the overall forecasting process with a focus on sales team performance.
- Sales Reps: A sales rep actively participates by sharing insights into customer interactions, deal progress, and market dynamics affecting sales.
- CEO: Holds a strategic oversight role, ensuring that a sales forecast aligns with the broader business objectives and contributing to high-level decision-making.
- CFO: Focuses on financial implications, ensuring that forecasts align with budgetary goals and providing insights into the financial health of the organization.
- CMO: Collaborates to align marketing strategies with a sales forecast, ensuring cohesive efforts to drive demand and achieve revenue targets.
Ready to Streamline Salesforce Forecasting With Scratchpad?
Accurate sales forecasting gives organizations the power to predict, plan, and achieve unprecedented success in their sales activities.
However, forecasting in Salesforce comes with a plethora of challenges.
What’s an easy way out?
Leverage a tool like Scratchpad to bid farewell to your Salesforce woes and empower your sales teams to achieve unparalleled growth.
Try it for free today and discover how it can help you improve your sales forecasting accuracy!


