
8 Types of Sales Forecasting Methods
There are eight commonly used sales forecasting methods.
If you want to create an accurate sales forecast model, you would typically need to use a combination of these methods. Relying on only one method will rarely suffice.
These methods are:
- Historical Forecasting
- Intuitive Forecasting
- Length of Sales Cycle Forecasting
- Opportunity Stage Forecasting
- Test-Market Analysis Forecasting
- Lead-Driven Forecasting
- Consumption-Based Forecasting
- Multivariable Analysis Forecasting
1. Historical Forecasting
Historical forecasting relies on past sales data to predict future sales performance. It involves analyzing trends, patterns, and outcomes from previous periods to make a sales projection.
For example, you can look at previous win rates, sales cycle lengths, etc., to estimate your future sales performance.
This forecasting technique assumes that historical patterns will continue.
Pros
- Relies on Actual Data: Uses historical sales data, providing a more factual basis for predictions – when compared with intuitive forecasting.
- Easy to Implement: Generally straightforward to apply, making it accessible for businesses with limited resources because all you need is past sales data.
Cons
- Assumes Past Patterns Will Continue: While it varies from industry to industry, dynamic markets like SaaS aren’t guaranteed to follow the same patterns year-on-year.
- Can’t Account for Recent Changes: Cannot factor-in sudden and significant shifts in consumer behavior or economic conditions.
2. Intuitive Forecasting
This sales forecasting method relies on the instincts and subjective judgment of individuals (such as seasoned professionals or experts) to predict future sales. It’s a qualitative approach that doesn't rely heavily on data but rather on the intuition and experience of the forecaster.
Pros
- Useful When Data Is Scarce: Can be applied in situations where historical sales data is limited or unavailable.
Cons
- Subjective: This sales forecasting technique is prone to personal biases and individual perspectives.
- Lacks Precision: May not provide detailed and quantifiable predictions.
- Not Easily Replicable: Difficult to reproduce the forecasting process consistently due to its reliance on personal intuition and judgment.
3. Length of Sales Cycle Forecasting
The length of sales cycle forecasting is a form of historical forecasting.
It involves estimating future sales based on the historical average time it takes for a lead to progress through the sales cycle. This forecasting technique typically considers the duration from initial contact to deal closure.
Pros
- Helps in Resource Planning: As you’re basing your forecast on predetermined timeframes, you can allocate resources efficiently based on the expected time to close deals.
Cons
- Assumes Uniformity in Sales Cycle Lengths: Previous sales cycle lengths are not guaranteed to repeat with each new deal.
- May Not Capture External Market Shifts: Like all historical-based methods, this method can overlook a new market trend that influences the overall sales cycle.
4. Opportunity Stage Forecasting
Opportunity stage forecasting builds on the historical forecasting method.
This sales forecasting method involves predicting an outcome based on the specific stage of the sales process an opportunity is in. It leverages historical data on how deals progress through stages to estimate the likelihood of successful closure.
For example, a deal in the proposal stage could have an 80% chance of closing based on previous results.
Pros
- Leverages Deal-Specific Insights: Helps assess the likelihood of successful closure based on the specific stage of the sales process. This offers a layer of granularity that methods like length of sales cycle cannot offer.
Cons.
- Disregards the Age of Each Opportunity: The opportunity stage forecasting method doesn’t account for the age of an opportunity. For example, a deal that‘s been in your rep’s pipeline for several months will be treated the same as one that’s a few weeks old — as long as the deals are in the same stage.
This can be a major issue as a deal that hasn’t moved for months is much more unlikely to close than one that’s been progressing well.
5. Test-Market Analysis Forecasting
This forecasting method involves introducing a product or service to a small, representative market segment to gauge its potential success and estimate the future revenue it may bring.
The results of this test market are then used to extrapolate and forecast broader market performance.
Pros
- Simulates Market Conditions: Provides insights into how the product or service performs under realistic conditions.
- Helps in Refining Pre-Launch Strategies: Results from test markets can inform adjustments to marketing and sales strategies before a full-scale launch.
Cons
- Costly and Time-Consuming: Implementing test-market analysis can be resource-intensive, especially for small businesses.
6. Lead-Driven Forecasting
Lead-driven forecasting focuses on the quantity and quality of leads in the sales pipeline. It assigns scores to leads and predicts future sales based on the characteristics and behavior of leads, considering factors such as lead source, engagement, and conversion rates.
Pros
- Considers Lead Quality: Takes into account the quality of leads, distinguishing between leads with higher and lower conversion potential.
- Allows for Targeted Strategies: Enables businesses to tailor their sales and marketing strategies based on the characteristics and behaviors of different leads.
Cons
- Dependency on Lead Scoring: This sales forecasting technique relies heavily on the scoring of leads. If you don’t have a reliable and efficient lead scoring system in place, the forecast can be inaccurate.
- Resource Intensive: Scoring and maintaining an extensive list of leads could require substantial resources, which might not always be feasible for all businesses.
7. Consumption-Based Forecasting
Consumption-based forecasting relies on analyzing past consumption patterns to anticipate future customer demand for products or services.
By examining historical consumption data, businesses can make an informed sales projection and optimize inventory management to meet customer needs efficiently.
Pros
- Reflects Actual Customer Behavior: Uses past consumption patterns to make informed projections about future demand.
- Helps Optimize Resource Allocations: Allows businesses to manage software development, recruitment, etc, efficiently by aligning it with anticipated consumer needs.
Cons
- Assumes Past Consumption Patterns Will Repeat: May not account for changes in consumer preferences or external factors that could alter consumption.
- May Not Capture Sudden Shifts in Demand: The reliance on historical consumption data might overlook abrupt changes in market demand.
8. Multivariable Analysis Forecasting
Multivariable analysis forecasting involves considering multiple variables simultaneously to predict sales outcomes. It uses statistical techniques to analyze the impact of various factors on sales, allowing for a more comprehensive and accurate forecast.
The most accurate forecasts are typically combinations of different variables and come under multivariable forecasting.
Pros
- Provides a More Nuanced Forecast: It’s a highly data-driven method that provides a more nuanced forecast. By simultaneously accounting for various variables, it provides a more in-depth understanding of the factors influencing the outcome. Essentially, this method enhances accuracy and enables more informed decision-making.
Cons
- Complex and resource-intensive: Requires advanced statistical tools and expertise, making it more challenging for some businesses to implement. Fortunately, with the right tools, this can be made easier.
By now, you’re probably wondering:
How Do You Choose the Right Sales Forecasting Method?
Selecting the optimal sales forecasting methods is key to strategic planning.
So, let’s take you through the process of choosing the right methods for your business:
- Consider Your Sales Goal: Ensure that the chosen forecasting methods align with the broader sales goal and strategies of the business. If you’re a new player in the industry and want to hit the ground running, the test-market analysis method might be your primary forecasting method.
- Consider Data Availability: Assess the availability and quality of past sales data. The methods you choose should align with the type and amount of data you have. For example, when your business has an extensive history of sales data, historical forecasting can leverage this wealth of information for a more accurate prediction.
- Evaluate Resource Availability: Evaluate the resources, including time and expertise, available for implementing and maintaining the chosen forecasting methods. For instance, if your business is resource-constrained without much historical data, you might have to rely primarily on intuitive forecasting.
- Check Historical Performance: Evaluate the historical performance of different forecasting methods. That’s because past success or failures can be indicative of future suitability. For example, if your business has a history of generating substantial revenue with advanced analytical methods and has the necessary data inputs, multivariable forecasting may continue to deliver an accurate prediction.
Note: As we mentioned before, most businesses always use numerous forecasting methods together – instead of selecting just one.
Picked a selection of forecasting methods?
It’s now time to explore the steps involved in the sales forecasting process:
How Do You Perform a Sales Forecast Using Your Chosen Method?
Here’s a step-by-step guide for performing an accurate sales forecast:
- Step #1 – Data Collection: The first step involves gathering relevant data, including historical sales figures, customer data, market trends, and any other information pertinent to the forecasting process.
- Step #2 – Data Analysis: Once data is collected, it undergoes thorough analysis to identify patterns, trends, and correlations. Statistical tools and techniques are often employed in this phase.
- Step #3 – Model Selection: Based on the nature of the data and the goals of the forecast, a suitable forecasting model is selected. This decision considers factors like accuracy, complexity, and interpretability.
- Step #4 – Forecasting: The chosen model is applied to make predictions about future sales. This step involves using historical data to project sales figures for upcoming periods.
- Step #5 – Validation and Adjustment: Forecasts are regularly validated against actual sales data. Any discrepancies are analyzed, and the forecasting model may be adjusted to improve accuracy over time and reach a certain sales target.
To re-emphasize how important it is to get your forecasts right, let’s go over the consequences that inaccurate sales forecasting can have:
What Is the Impact of Inaccurate Sales Forecasting on SaaS Businesses?
Inaccurate sales forecasting can lead to:
- Overprovisioning or Under Provisioning of Services: Inaccurate forecasts can lead to overprovisioning or underprovisioning of services in the SaaS industry, impacting the optimal utilization of cloud resources.
- Misallocation of Development and Support Resources: Inaccurate predictions may result in the misallocation of development and support resources, impacting the efficiency of SaaS operations and hindering software development.
- Flawed Product Roadmaps and Feature Releases: Strategic decisions related to product development, feature releases, and marketing campaigns may be flawed, impeding the growth trajectory of SaaS companies.
- Strained Partner and Integration Relationships: Inaccurate forecasts can strain relationships with integration partners and third-party service providers, especially in the context of sudden changes in demand for SaaS solutions.
How do you tackle all these challenges and achieve accurate sales forecasting?
How Do You Improve Sales Forecasting Accuracy?
A few ways to improve forecast accuracy include:
1. Regular Review and Adjustment
Regularly review and update forecasts based on changing market conditions and new data in your CRM pertaining to your existing pipeline. You should also consider the feedback from other sales, GTM, and finance leaders in the organization.
Evaluate how your forecasts are doing and pivot if needed if a method isn’t working out for you.
Another good practice for accurate sales forecasting is establishing a dynamic forecasting process that allows for ongoing adjustments.
This, of course, is dependent on you having the resources to do so.
Fortunately, with the right technology, you don’t need much to get a lot done:
2. Rely on Technology
Leverage modern forecasting tools like Scratchpad to instantly enhance your forecasting capabilities.
What is Scratchpad?
It’s a tool that helps sales teams work together and faster in Salesforce. It makes managing pipelines, inspecting deals, coaching, and forecasting seamless.

But why use Scratchpad?
A. Rollups
Scratchpad automates the rollup process, eliminating the need to use a spreadsheet.
Scratchpad’s rollup feature helps you track how each deal changes over time at every level and gives you the necessary context behind changes.
Here’s an example of a roll-up chart where you can see deals based on specific departments, regions, teams, or individuals. Upon clicking into a specific rep, you can see which opportunities make up their pipelines.
You’ll also see the details of those opportunities so you can get a full understanding of the health of your entire sales pipeline:
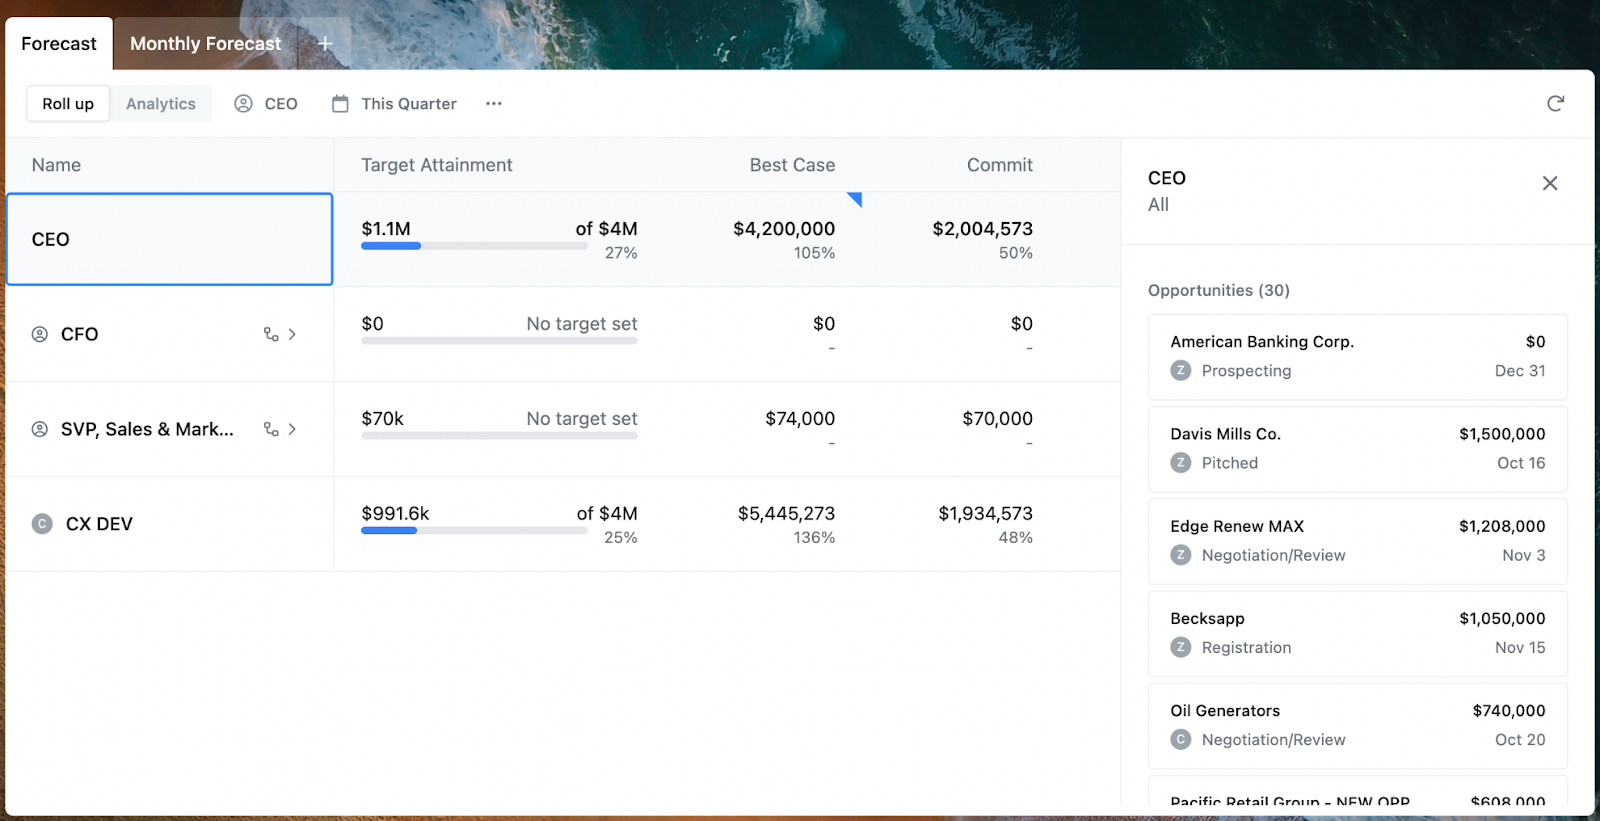
With Scratchpad, you can easily drill down to see potential gaps or red flags that could prevent losing a deal for something that you could have acted upon.
And unlike using spreadsheets, Scratchpad Rollups are dynamic. So, changes made to a deal in Rollups are reflected in real-time in Salesforce.
With one click, a sales leader can view every data point tied to a specific opportunity — allowing them to analyze and assess the deal quality effectively.
B. Waterfall Analytics
Scratchpad’s Waterfall Analytics offer a simple breakdown of your forecast changes and the reasons behind them to ensure your sales forecast is always aligned with your existing pipeline.
In Waterfall Analytics, there are different categories representing changes that occur to your pipeline.
The standard categories are Moved out, Date pushed, Value (Decrease), Value (Increase), Date pulled, and Moved in:
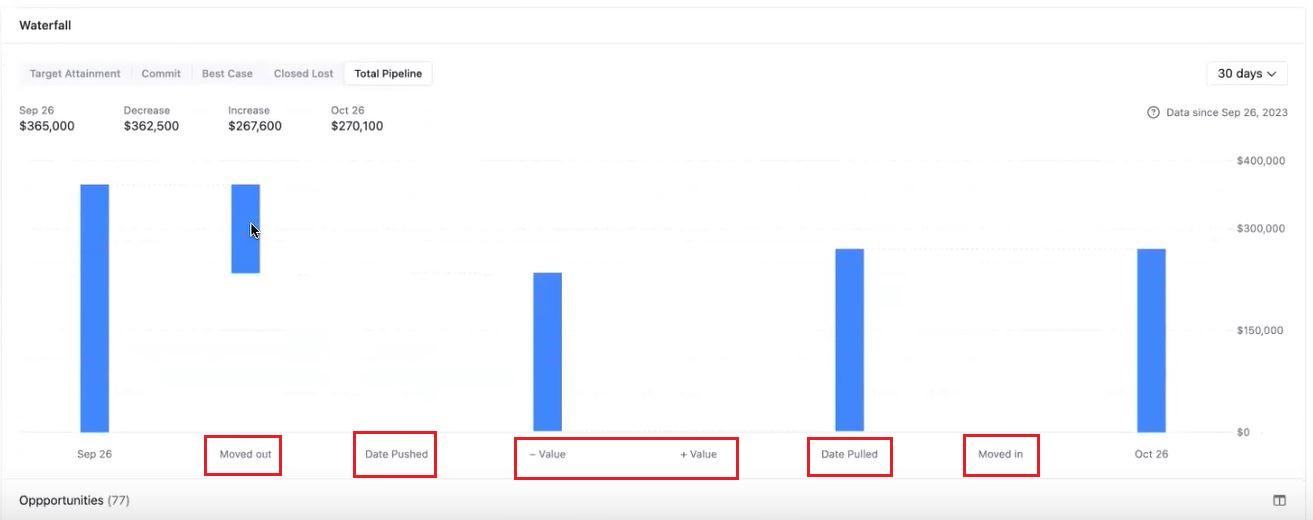
Here’s what each category means:
- Moved out: Refers to a deal that no longer matches the category filters or has been closed and moved out of the pipeline.
- Date pushed: Signifies a deal that got pushed to the next quarter.
- Value: This shows the increase or decrease in the dollar amount of a deal within a specific category.
- Date pulled: Refers to an opportunity that fell within the forecast time period due to a moved-up close date.
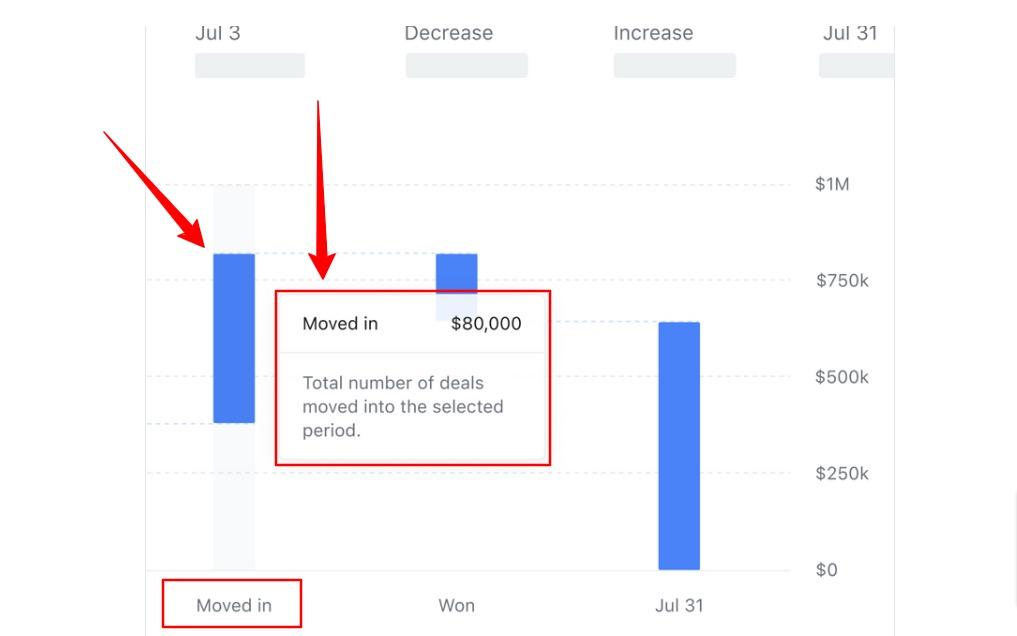
- Moved in: indicates a new deal that just entered the pipeline and can be tracked in the forecast.
However, you aren’t limited to visualizing things by forecast category (such as Best Case, Commit, etc). You can also display your forecast by sales stage (such as Qualified, Proposal, Negotiation, etc).
How does this help?
This gives sales leaders the visibility to identify issues and proactively step in to help reps with deals stuck in specific sales stages.
Whether sales leaders are analyzing Waterfall Analytics by forecast category or sales stages, they get to see their entire pipeline in one simple pane of glass. This provides them with reliable information they can trust and have confidence in.
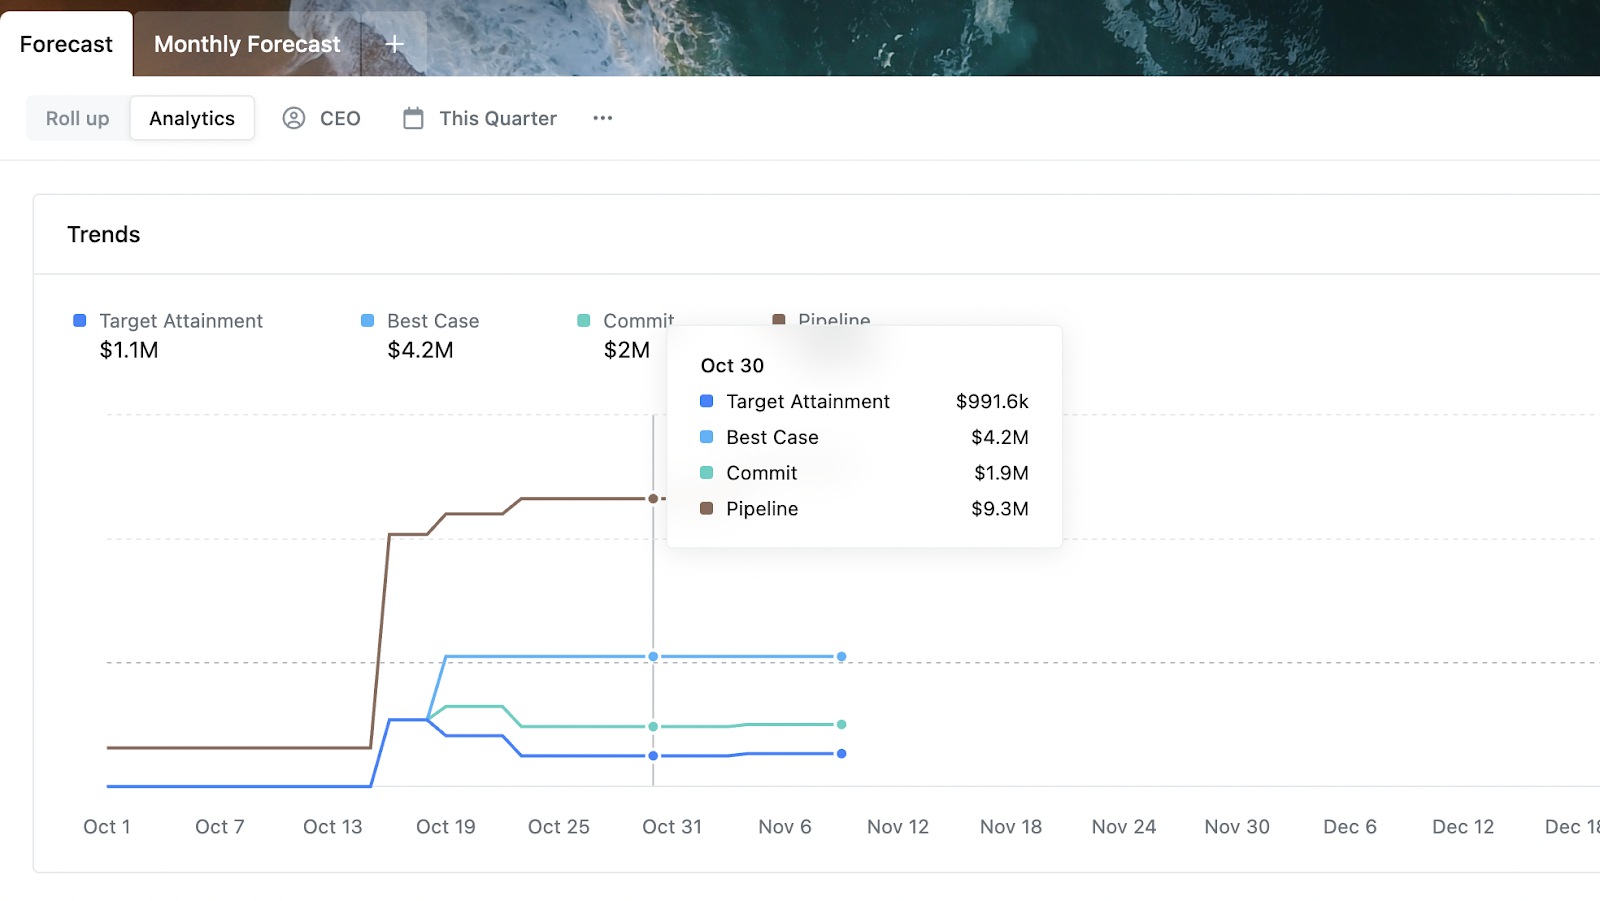
C. Sales Trends Analytics and Daily Snapshots
Scratchpad’s Sales Trends Analytics allows you to identify how your sales forecast evolves over time. This allows you to compare your current data to that of past months, quarters, or years.
Within Trends Analytics, there’s a tool called Daily Snapshots. This feature gives you a historical record of pipeline changes made daily and allows you to drill down into how trends change at any given time. No more juggling spreadsheet tabs!
D. Scratchpad Command
Scratchpad Command brings Salesforce to users no matter where they are on the web — consolidating disconnected note-taking apps, spreadsheets, docs, and more.
It offers a sales rep or sales manager an easier way to manage their entire pipeline. This can be quite useful for a sales team that has most of its work outside the CRM or is managing several sales opportunities simultaneously.
How does the tool work?
Scratchpad Commands allows you to:
- Search, update, create, and view any records.
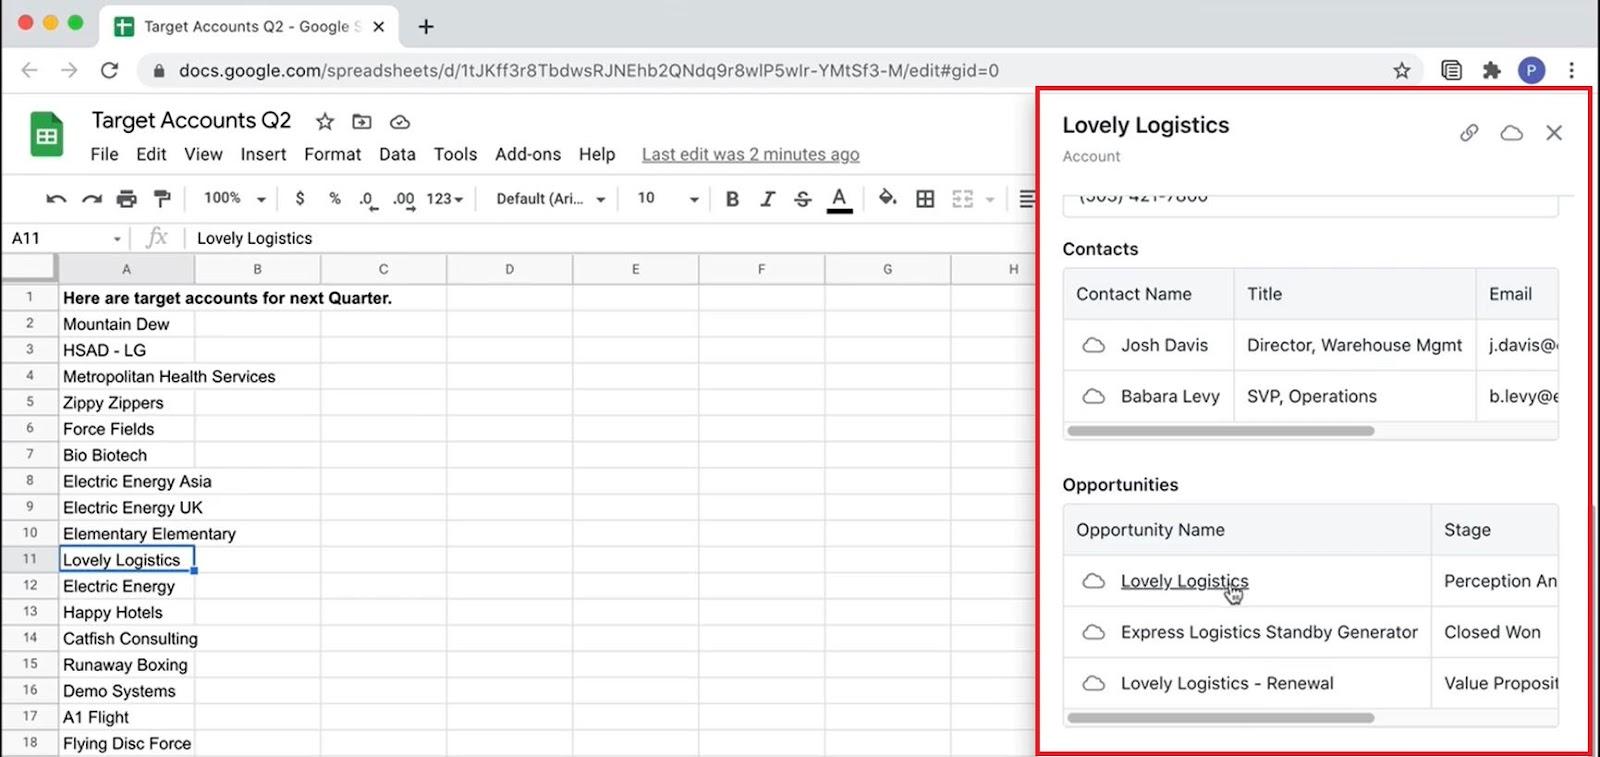
- Easily import data from a spreadsheet (or a prospect’s website) to the CRM. For instance, let’s say a customer has stored data points not tied to specific fields in CRM in Google Sheets. They can use Scratchpad Command directly from Google Sheets to easily port data into Scratchpad/Salesforce.
To illustrate this example, here’s a screenshot showing Google Sheets and the Scratchpad Command feature (Scratchpad Command appears on the right-hand side):
Sounds interesting, right?
Book a demo to see how Scratchpad can streamline your Salesforce forecasting workflows!
Now, let’s go through a few other sales forecasting questions:
3 Sales Forecasting FAQs
Here are some sales forecasting questions and their answers:
1. What Are the Main Sales Forecasting Approaches?
Let’s take you through the two main sales forecasting approaches.
Most forecasting methods involve a combination of the two.
Top-Down Approach
The top-down sales forecasting starts with senior management setting an overarching sales target for the organization, which is then hierarchically distributed to specific segments.
While offering a broad organizational perspective and facilitating centralized decisions, it may lack the detailed insights crucial for specific products or regions. This approach typically assumes uniform market conditions across segments and relies on senior leadership expertise.
Bottom-Up Approach
The bottom-up sales forecasting begins at the grassroots level, with individual sales teams providing localized forecasts. These are then aggregated to form departmental, regional, and overall organizational forecasts.
Capturing detailed insights from the frontline, it allows for a nuanced understanding of market dynamics. Decision-making is decentralized, enabling adjustments based on specific market conditions.
This approach is effective when a uniform approach may not accurately represent diverse market conditions.
2. What Is the Difference Between Sales Forecasting and Demand Forecasting?
Demand forecasting and sales forecasting are interconnected yet separate facets of business planning. Here’s how you can differentiate them:
- Sales Forecasting concentrates on estimating the sales revenue a business will make from its products or services over a period.
- Demand Forecasting entails projecting the potential number of customers interested in and likely to purchase a specific product or service. It helps businesses strategize for development, SaaS deployment, and marketing initiatives.
3. What Are the Factors That Can Impact Your Sales Forecasting?
Let’s unravel all the key factors that can influence sales forecasting accuracy. Understanding these elements is pivotal for strategic decision-making in a dynamic business landscape.
- Nature of the Product or Service: Different products or services may require specific forecasting approaches based on factors like seasonality, product life cycle, and customer demand patterns. For instance, tax filing software will usually see an uptick during tax season.
- Market Conditions: Market conditions, including competition, regulatory changes, and economic trends, influence the choice of forecasting methods. A volatile market may require more adaptive methods.
- Availability of Data: The quality and availability of past sales data impact the selection of forecasting methods. Data-rich environments may facilitate more sophisticated modeling techniques.
- Company Size and Resources: The size and resources of a company influence its ability to implement certain forecasting methods. Smaller businesses may opt for simpler methods (such as length of sales cycle forecasting) due to resource constraints.
- Industry Specifics: Certain industries have unique characteristics that shape the choice of forecasting methods. For example, industries with rapidly changing trends (like the technology sector) may favor more agile methods, like multivariable analysis forecasting.
Simplify Your Sales Forecasting Process With Scratchpad!
The diverse array of sales forecasting methods serves as a strategic compass for businesses. Each method contributes to informed decision-making, paving the way for adaptability and success in the ever-evolving market landscape.
But forecasting with sales forecasting software and CRMs like Salesforce comes with lots of challenges.
Want an easy way out?
Scratchpad can help!
This add-on tool streamlines your sales forecasting process and allows your sales teams to work faster in Salesforce.
Try it for free today and discover how it can empower your sales rep, sales manager, and the entire sales team to achieve unparalleled growth.


